THURSDAY, Jan. 6 — An online tool released today by the city of Lansing aims to keep track of diversity among its employees, as well as in local neighborhoods, so that city officials can monitor racial disparities and factor them into decisions tied to policies and the city budget.
Lansing Mayor Andy Schor and a host of other city officials introduced the new “Diversity Dashboard” and “Equity Matrix” at a virtual press conference today. Both are online now.
The diversity dashboard — assembled entirely by demographic information volunteered by city employees — compares the racial and ethnic composition of city staffers to the rest of the city. The goal: Recruit and maintain a workforce that physically resembles the community it serves.
“This will be a great tool for senior leadership to analyze disparities and modify recruiting strategies,” explained Guadalupe Ayala, who was hired last January as the city’s first diversity, equity and inclusion officer. She also noted that the statistics will be “constantly monitored.”
Schor, for his part, said the data released today already reflects a fairly diverse workforce — though he noted that improvements can always be made. All told, the city’s workforce is about 70% white and 18% Black. Census data pegs the city at about 61% white and about 23% Black.
Still, some departments are more diverse than others. City TV, Lansing’s official broadcast station, is staffed entirely by white people, according to the data. The City Attorney’s office was also among the least diverse, with only about 9% Black employees. The Human Relations and Community Services Department was listed as the city’s most diverse department at 50% Black.
Schor’s staff was listed at about 27% Black, which was also above the city’s overall average.
Here’s how the other departments stacked up on the diversity dashboard:
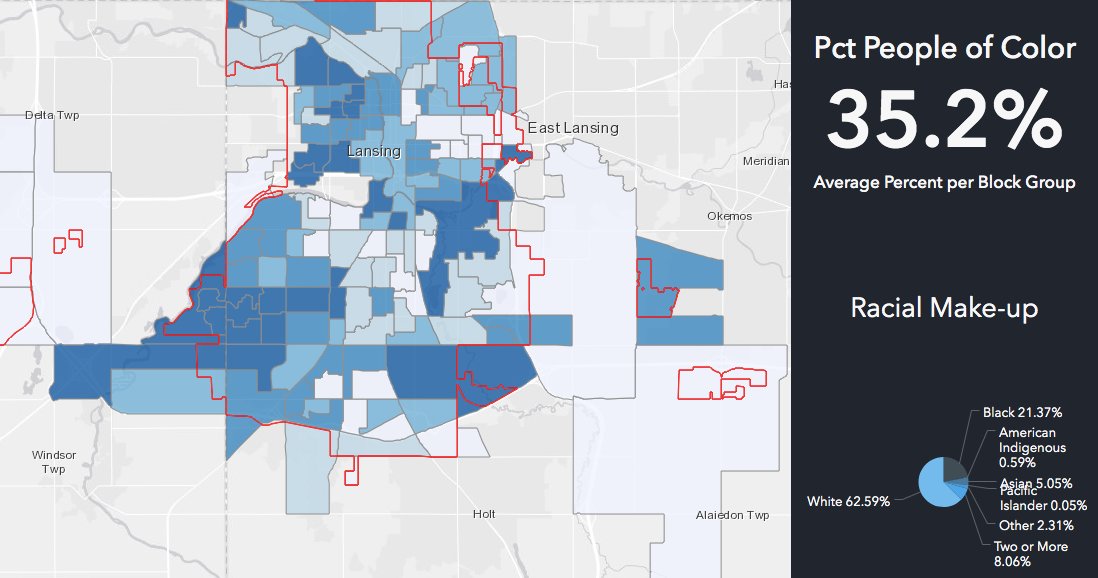
Ayala described the equity matrix as another interactive tool to help visualize local demographics and disparities, which will help city officials — and others — decide which geographic areas of the city could use the most help in erasing long-standing racial inequities.
That page includes a map of Lansing broken into distinct “Block Groups,” each with demographic information about race, language, income and educational attainment. The map also highlights several areas of the city still feeling the racial impacts of mortgage redlining.
Using the data, local nonprofit groups should also have a much easier time securing grant funding for programs that are designed to provide services for at-risk populations, officials said. Parks Director Brett Kashinske said the matrix will also help his staff determine which neighborhoods may need more youth programming opportunities at local community centers — all part of what Schor labeled as Lansing’s “next step” in leveling the racial playing field.


Support City Pulse - Donate Today!
Comments
No comments on this item Please log in to comment by clicking here